Artists using maps to tell stories
Maps provide great source material for artists. Their visual imagery, full of lines, shapes, and colors is a great jumping off point. The geographic details of maps tell stories. Even the physical properties of maps can become the tangible media of artwork.
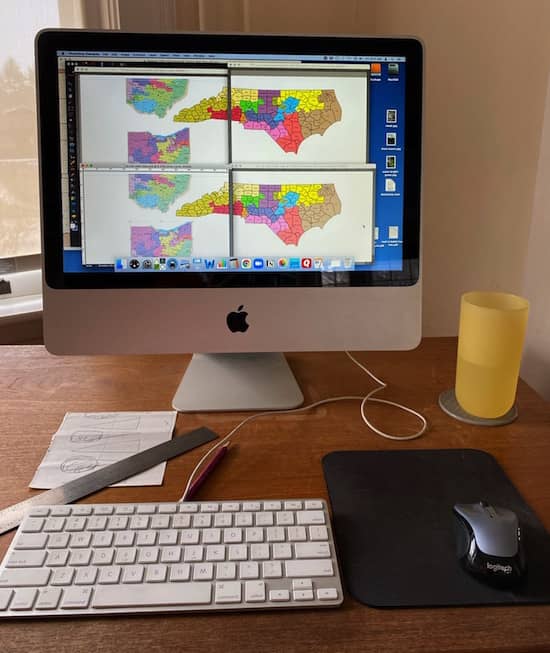
Maps of congressional districts drawn by state legislatures form the backdrop for my sculptures of green herons and salamanders. I am still figuring out exactly how to use the maps in this installation, sizing them to complement the birds. I am intrigued by the visual appeal of the oddly shaped districts, highlighted in different colors. I can use Photoshop to accentuate the colors and arrange maps of various states or districts. The challenge is not to lose the information in the maps as I play with the design.
It’s important to me that the viewer sees the gerrymandered districts depicted in the maps. The North Carolina map on my computer screen in the photo above came from legal briefs filed in the U.S. Supreme Court in Rucho v. Common Cause (U.S. 2019) a case about partisan gerrymandering.
Maps provide intriguing visual imagery
In her work Dogpatch, the sea is rising: 0, 3 and 6 feet artist Linda Gass used aerial maps of San Francisco to show the impact of climate change. Working with images of detailed maps of a section of San Francisco, she graphically depicted how the neighborhood will change as water rises. She studied the topography and used colors to show the coastal changes, illustrating them in Photoshop. Printed on fabric and stitched into a painting, they form a pleasing colorful design.
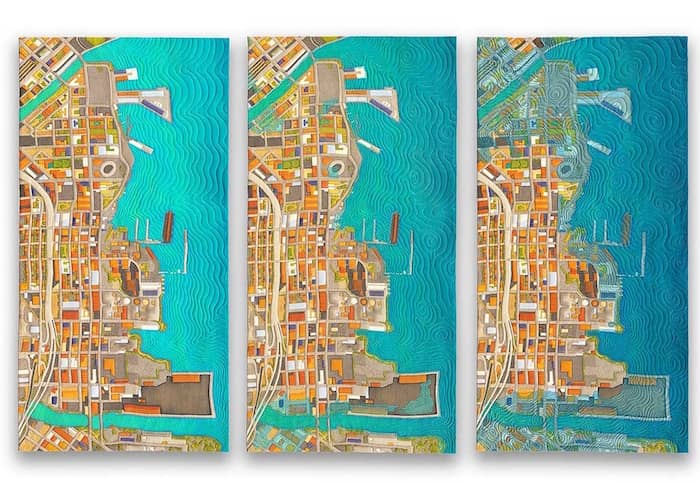
Dogpatch, the sea is rising: 0, 3 and 6 feet, (triptych) by Linda Gass ©2019, stitched silk (digitally printed silk crepe de chine, recycled polyester batting, Lutradur, rayon/viscose and polyester embroidery thread ), 3 panels, each 35½” h x 18” w x 1½” d. Photograph by Don Tuttle.
The viewer is drawn in by the shapes and the luscious colors before realizing that the images tell a story of inundation and destruction. It is an attractive way to convey data that can be difficult to interpret from the abstraction of numbers in a table.
Maps in artwork add layers of meaning
Road maps tell stories of journeys. Artist Fidencio Fifield-Perez works with physical maps that he collects from government libraries that are de-accessioning documents. For Barn Quilt he cut the map by hand, creating a geometric pattern resembling a chain link fence. From a distance it is not apparent that the canvas is a map, but on close inspection one can catch glimpses of words and lines. For Fifiled-Perez maps represent his personal journey of immigration from Mexico to the United States.
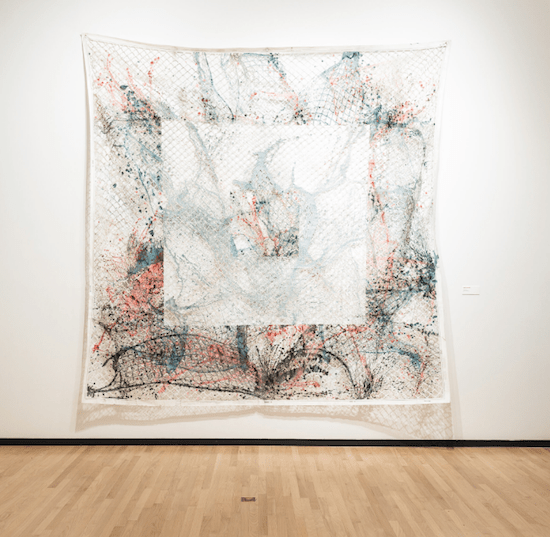
Barn Quilt © 2019 Fidencio Fifield-Perez, acrylic, ink, on found maps, 10.5 x 10.5 feet.
While the quilt imagery in this work is a comforting metaphor, the shadows created as light shines on the cut paper evoke the uncomfortable reality of people not fully accepted into American society. Read more about this work here. The map on which this quilt is painted is a representation of boundaries defined by those in control.
Control over boundaries is what gerrymandering is all about. State legislatures control how electoral district maps are drawn, and the U.S. Supreme Court has decided not to interfere, no matter how egregiously unbalanced the maps are drawn. With sophisticated computer mapping programs, legislatures can drawn strangely contorted shapes that maximize the number of districts they can win. Instead of following natural community boundaries, they cut lines through cities, circle bits of counties and combine residents into electoral districts whose share no common interests but are placed together solely to create districts that the legislature’s preferred candidates can win. This dilutes the voting rights of residents, distorting the outcome so that the political party with the least popularity nonetheless wins the most seats in Congress. (Read how gerrymandering created the current Congressional makeup in this post on the FiveThirtyEight website and see some amazing interactive maps.)
The following diagram shows how the placement of district lines changes who wins elections.
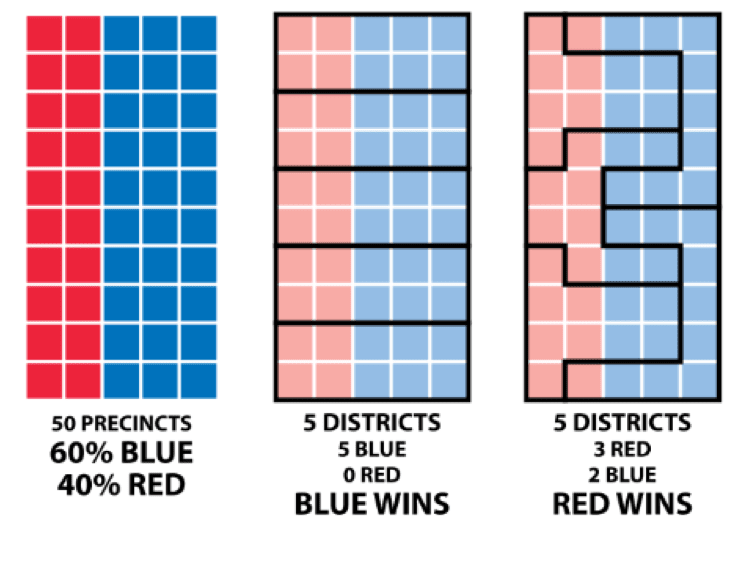
Steve Nass, Wikimedia Commons
The word gerrymander comes from a 19th century political cartoon that likened the districts approved by New York Governor Elbridge Gerry to salamanders. When this sculpture installation is completed, there will be salamanders crawling the maps at the feet of the green herons. For now, the green herons wait patiently. You can read about the knitting that went into the herons in this post.
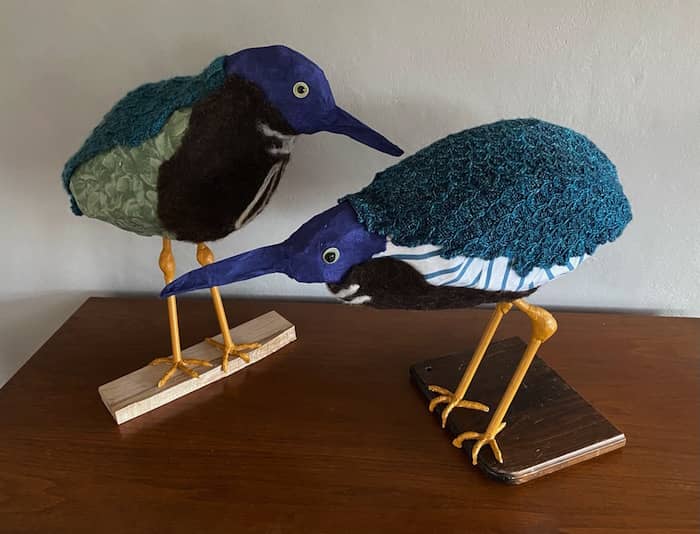
Herons 3 and 4, work in progress, part of installation. © 2021 Eve Jacobs-Carnahan
To learn more about how our electoral system works, attend one of my Knit Democracy Together knitting circles. We’re building a knitted sculpture of a state capitol to symbolically represent democracy while holding discussions about our electoral system. Learn all about the project here.
This was So interesting and informative. I did not know the history of jerrymander.
Thanks,
Nicole Copel
Thanks, Nicole. I love word etymology and the history and culture that you learn along with it.